The newest version of our Genotype Report is easier to use and is now mobile friendly.
Genomic analysis can be complex, and these updates provide digestible information and actionable insights. When customers send their samples in for the Phylos Genotype Test, they are looking for information that will help them identify unknown cuts, make strategic crosses in a breeding project, or create transparency throughout the supply chain as the plant moves from nursery to cultivation to distribution and beyond.
As the Phylos Galaxy has grown from its initial research samples to over 3000, we’ve made regular updates to ensure customers have the most accurate and useful data about their plants. With this latest release, we’ve updated the style of all of the charts and made it easier to review the information about your sample. Additionally, the entire report is now mobile friendly and printable.
Report Overview
When reviewing your Genotype Report, you’ll notice that several elements of the report header design have changed. The background color now corresponds to the primary sub-population profile color and buttons have been added for easier user navigation. Additionally, the Phylos Tested seal replaces the Phylos Certified DNA fingerprint seal.
Closest Genetic Relatives
To allow for easier interpretation of sample relatedness, the circular visualization of a sample’s genetic relatives has been replaced by a list that allows the user to easily scroll through a variety’s genetic relatives. The new ‘Relatives’ threshold replaces ‘Immediate Relatives’ and ‘Non-Immediate Relatives’ with Relatives listed in descending order, based on relatedness. The circles to the right of listed genetic relatives indicate clone groups. Users can click on a genetic relative or clone group circle for more information.
Genotype Report Closest Genetic Relatives visualization
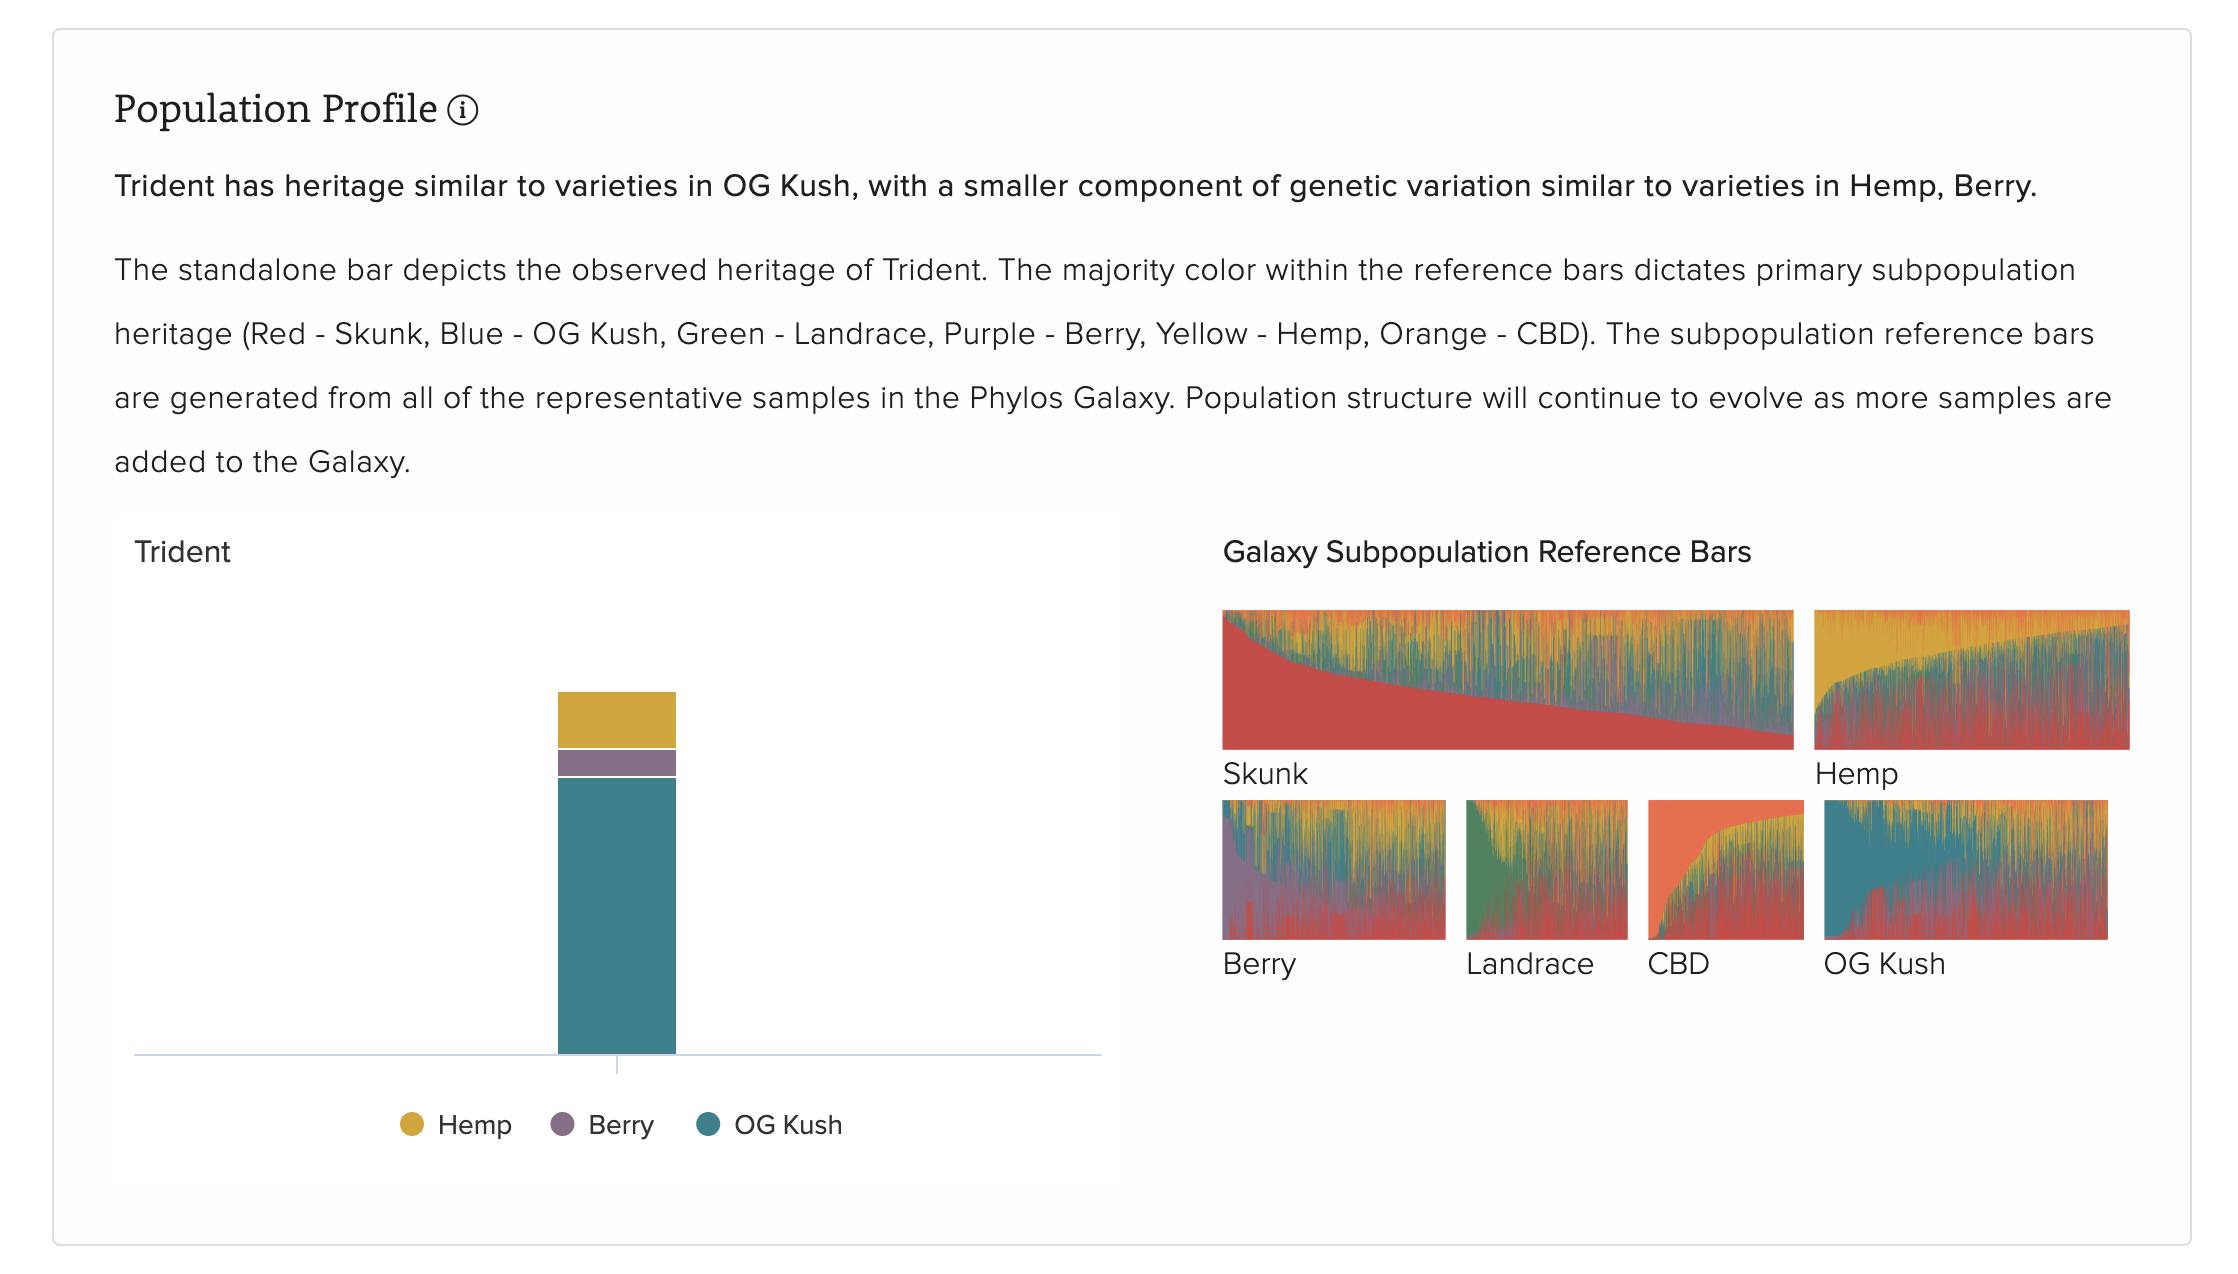
Population Profile
We changed the layout and design of the population profile so the user can more easily see the population heritage of the variety, and the ratios of each subpopulation.
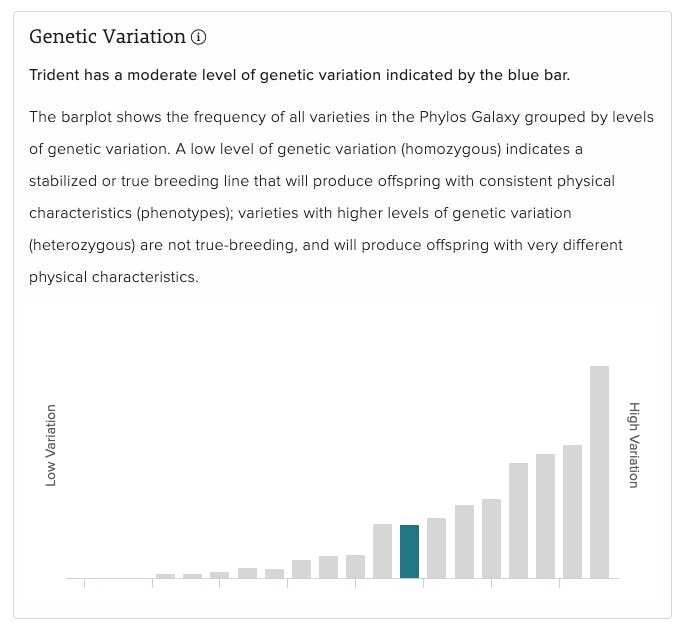
Genetic Variation
This visualization has been updated to use a highlighted bar to show the segment where the sample is bucketed. Genetic variation increases as you move from left to right on the X-axis. The highlighted bar shows the bin the sample fits into and the height of the bar shows how many other samples are in the bucket.
Genetically Distant Varieties
The Genetically Distant Varieties are now displayed in an interactive 3D chart with color identification connected to the population profiles of the varieties to provide our users with an easier to interpret visualization of varieties with limited genetic similarity to the sample submitted for analysis.
> Learn more about Clone Groups in the Phylos Galaxy
> Explore the Phylos Galaxy